In an increasingly connected and digital world, where everything constantly interacts via telco networks such as men, machines, cars and so on, it has never been so crucial to know the quality of the mobile networks’ coverage. For nearly 10 years, nPerf has been collecting billions of coverage data 24 hours a day, 7 days a week thanks to our mobile application.
Questions still remain: what are coverage data exactly? How are they collected? What are they for? nPerf gives you some insight into highly valuable network metrics.
What are coverage data?
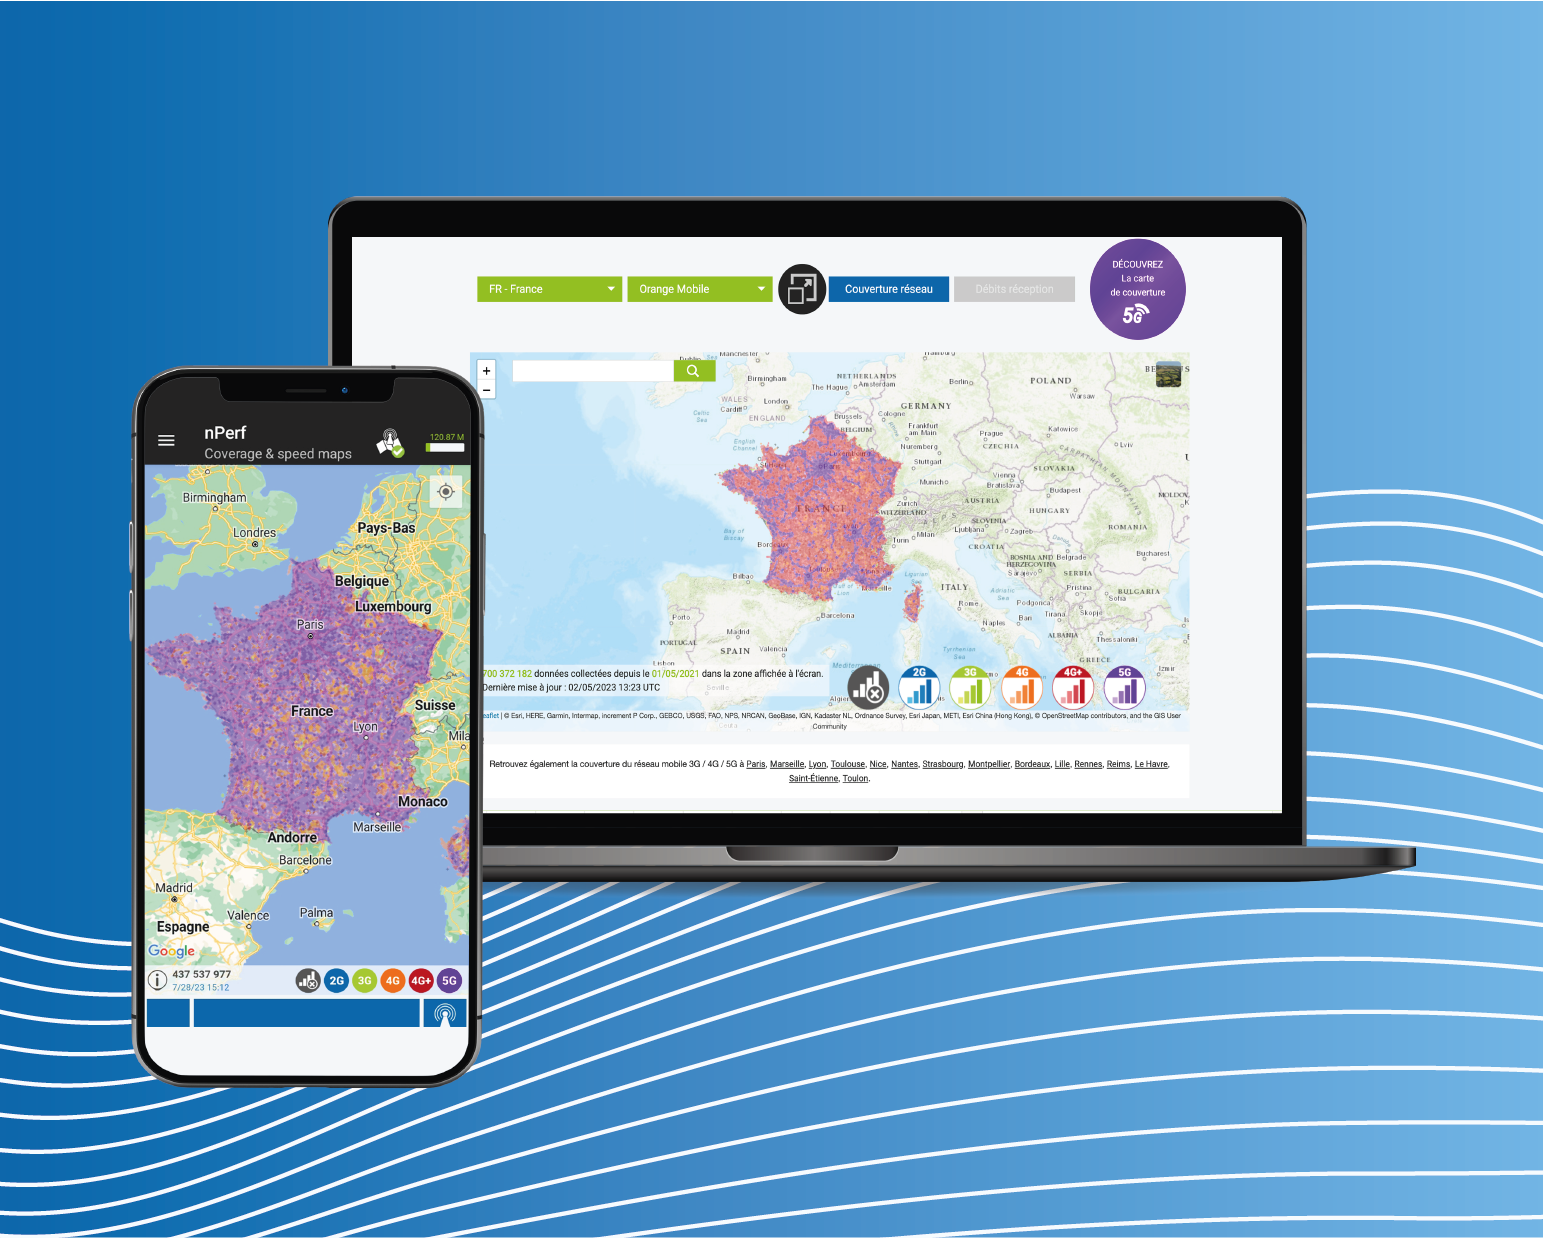
Network coverage means the geographical area within which a mobile operator services can be accessed by its subscribers. For experts, coverage data include RSSI, RSRP, RSRQ, … For the non-specialists, they correspond to the small bars that appear on your smartphone screen and indicate the signal strength at a specific time and place.

At nPerf, we collect signal strength data from our speed test app, in a complete transparency with users. By running a speed test on nPerf, users are taking part in a global effort to map the most comprehensive view of operator coverage. The more data there are, the more accurate the map is. Today, we have billions of scans around the world, creating one of the largest coverage measurement databases updated in real time.
What are they for?
- Optimize existing networks
Mobile network operators are facing a challenge when it comes to network optimization: providing a better service to subscribers, while reducing their costs. With coverage data collected on field by their subscribers, mobile operators can rely on a map to directly visualize where to implement infrastructure changes that have the most impact on their customers and find blackspots as well (no signal areas).
These data are in fact significant because they reflect the reality on the ground. Most of data provided by the operators are measurements from modeling systems. However, the nPerf data are metrics directly from their customers. As a nPerf client, operators get access to the nPerf Cockpit, our comprehensive online platform, which includes Internet performance statistics in the dedicated country such as coverage data. The data can be visualized by technology (no coverage, 2G, 3G, 4G, 4G LTE, 5G) over a configurable period of time. It is a great tool to identify poor signal coverage areas.
2. Reduce spendings of measurement campaigns
Mobile network operators often determine rooms for improvement based on expensive drive test campaigns. But a complementary efficient way is by using coverage data. Before sending field technicians conducting drive tests, analyzing coverage data is an accurate way to track the deployment of infrastructure changes, and monitor competitors.
3. Only for mobile operators? Example: self-driving vehicles
If the first users of coverage data are mainly telco operators and tower companies, they are also necessary for other players who need to know the reality of network coverage in given locations. One of the most emblematic examples may be the automotive industry.
Self-driving vehicles indeed need data to achieve a seamless connected experience. In fact, radio scans may be used to plan the car’s route or to ensure a comfortable tour for the passengers while enjoying its connected devices.
___________________________________________________
Network coverage is constantly evolving. Not a day goes by without an operator installing a new antenna, changing technology, and improving its infrastructure. Using nPerf coverage data is a real asset in monitoring the reality on the ground. In a world where cars, drones and other machines use cellular networks, whoever has this information will have a definitive advantage in their decision-making.
Interested in analyzing the nPerf coverage data? Contact us.
